Visualizations
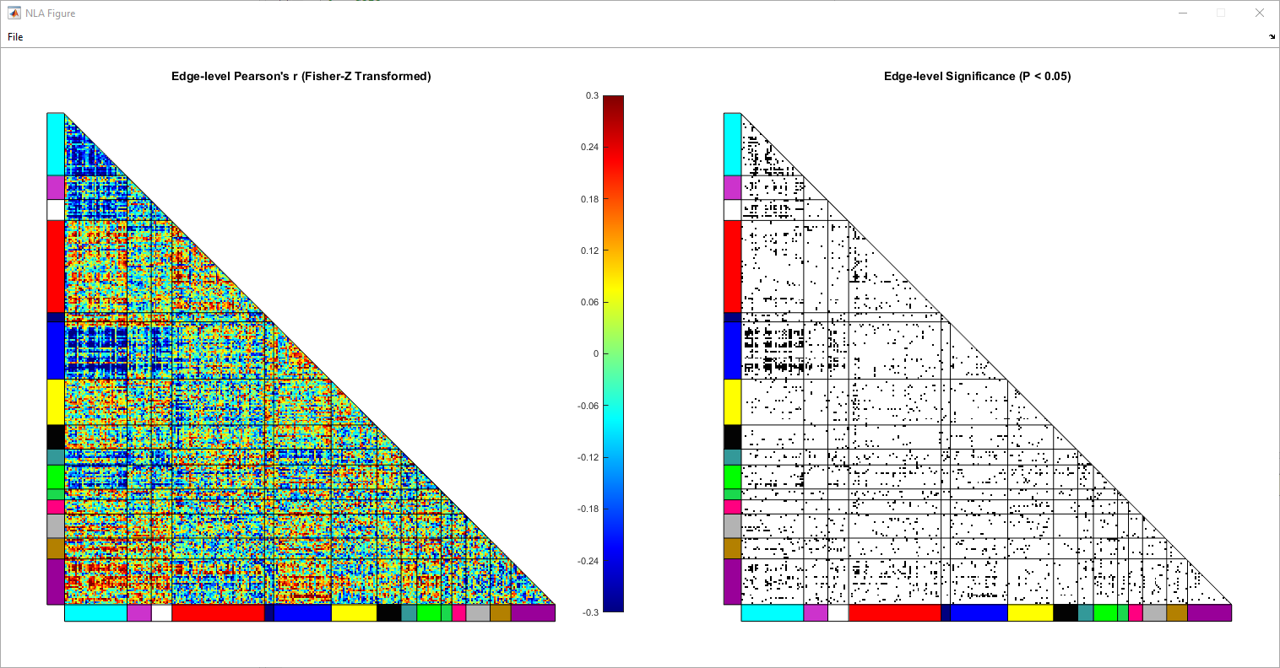
Edge-level Results
Edge-level Results are visualized in color as correlation coefficients and nominally thresholded and binarized p-values in black and white.
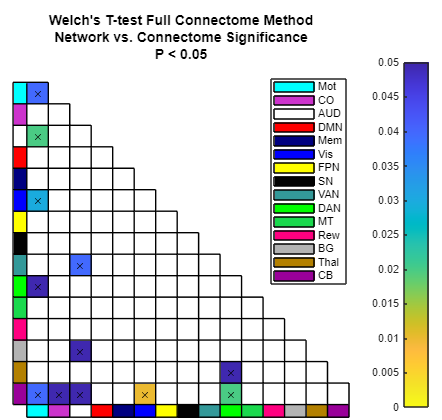
Network-level Results
Net-level results are visualized in a lower triangle matrix. (See Lower Triangle Network-Level Results Window). Significant network pairs are marked with a black X.
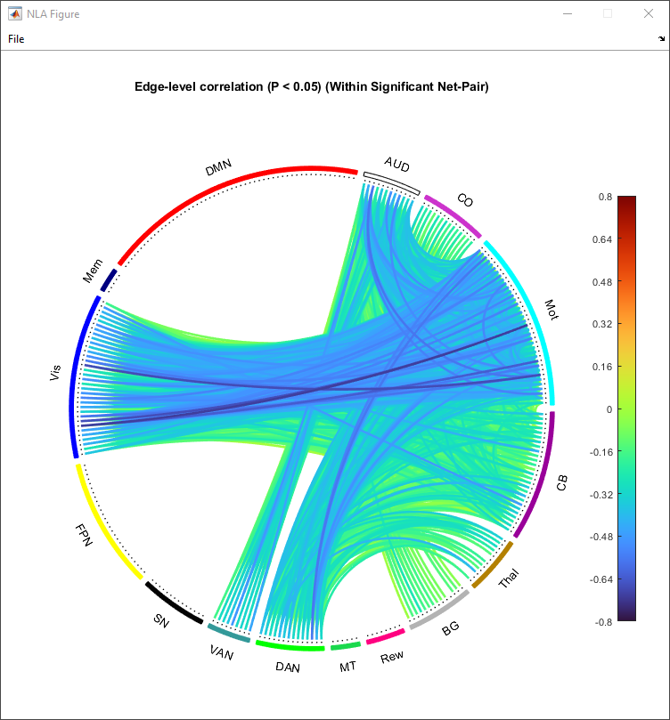
Edge-level Chord Plots
Edge-level chord plots show all edge-level results for significant network pairs after analysis. (See Lower Triangle Network-Level Results Window for all plotting options).

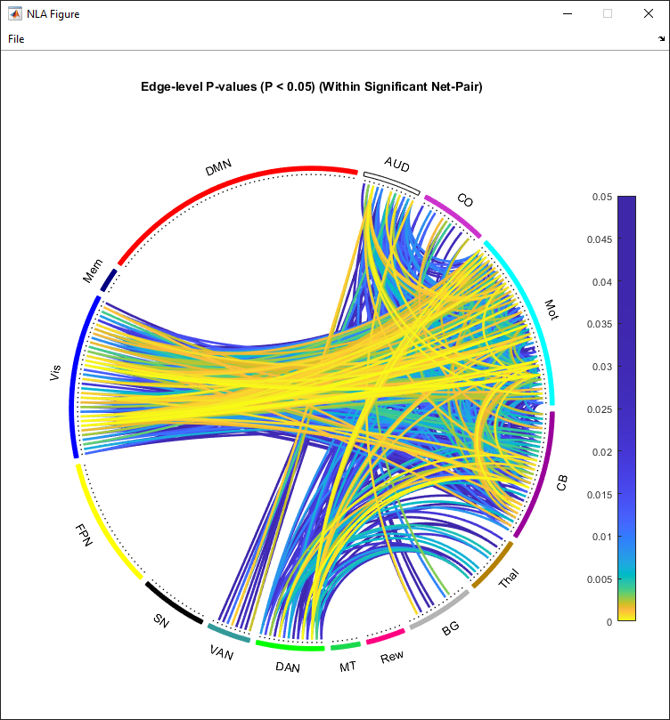
Type: p-value
Type: coefficient
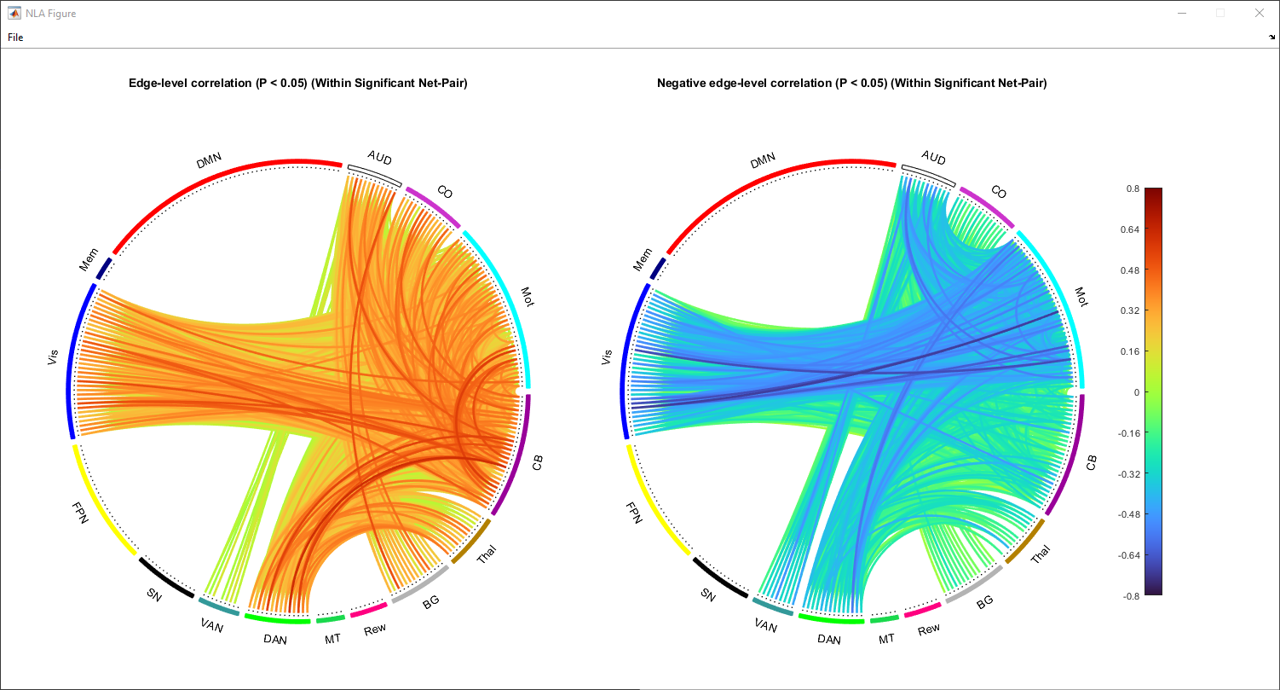
Type: coefficient, split
Type: coefficient, basic
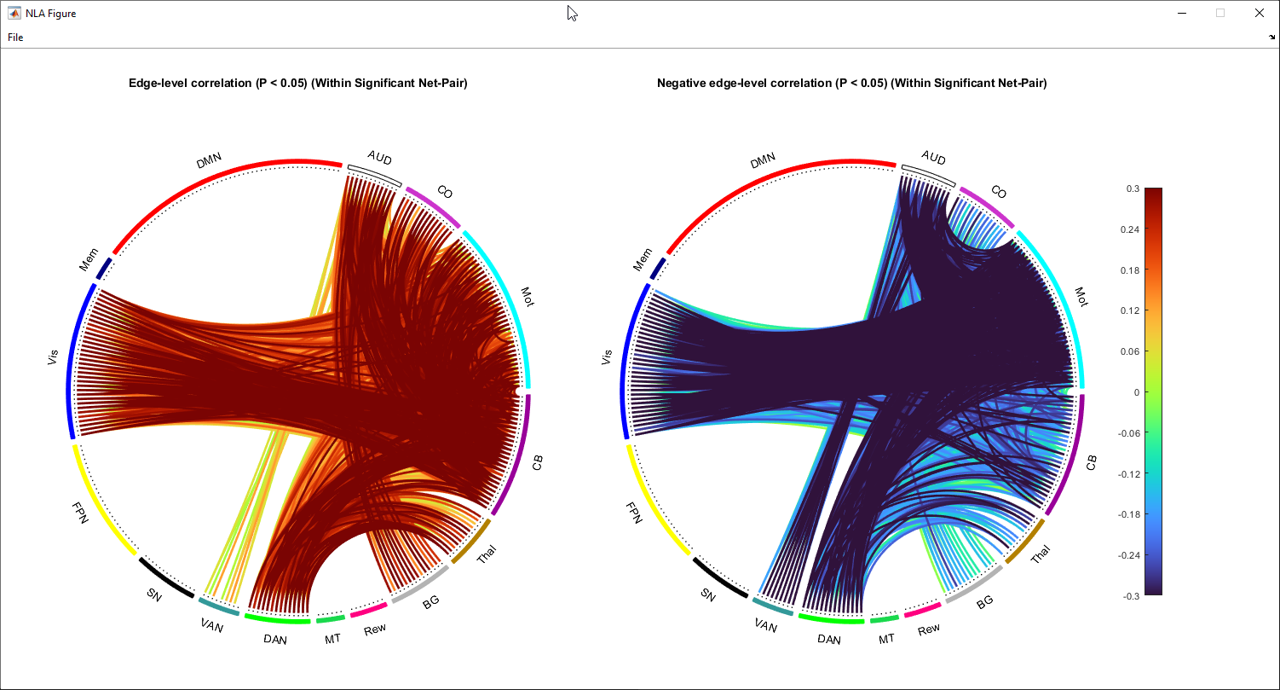
Type: coefficient, split + basic
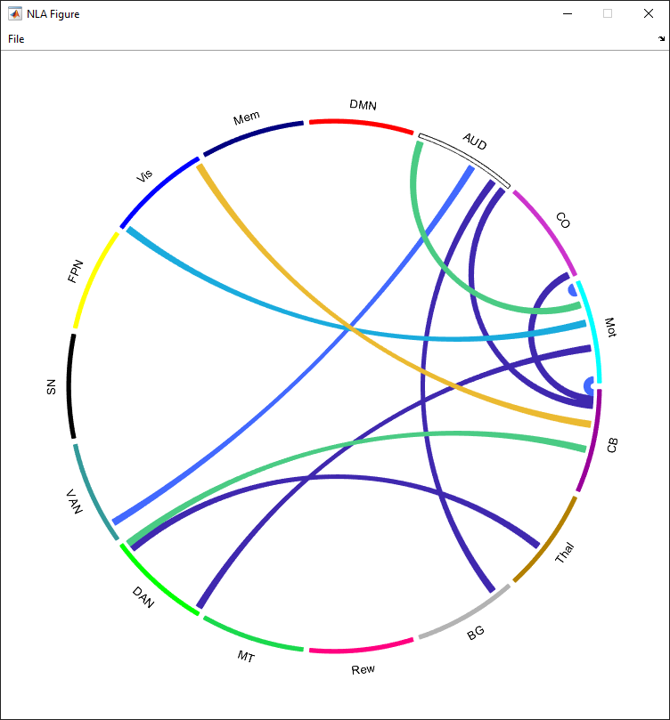
Net-level Chord Plots
Net-level chord plots show all net-level results for significant network pairs after analysis.
Convergence Map
Convergence maps show network pairs that are significant across multiple tests and/or methods. Select multiple tests in the results window (See Results Window)” and then click the View Convergence Map button.
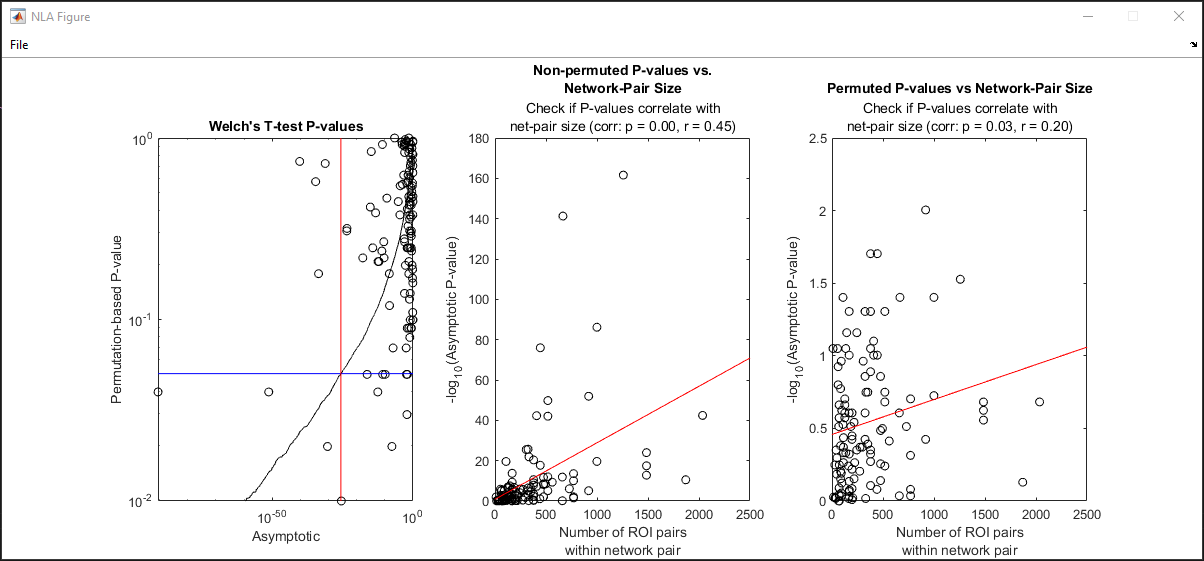
Network Pair Size Diagnostic Plots
Network pair size dianostic plots detail the effects of network pair size on results. The leftmost plot has non-permuted p-values on the x axis and permutation-based p-vaues on the y axis. The middle plot shows non-permuted p-values for all network pairs against network pair size, and the rightmost plot shows permuted p-values for all network pairs against network pair size.